Working with the QuTiP Documentation
The user guide provides an overview of QuTiP’s functionality.
The guide is composed of individual reStructuredText (.rst) files which each get rendered as a webpage.
Each page typically tackles one area of functionality.
To learn more about how to write .rst files, it is useful to follow the sphinx guide.
The documentation build also utilizes a number of Sphinx Extensions including but not limited to doctest, autodoc, sphinx gallery and plot. Additional extensions can be configured in the conf.py file.
Directives
There are two Sphinx directives that can be used to write code examples in the user guide:
For a more comprehensive account of the usage of each directive, please refer to their individual pages. Here we outline some general guidelines on how to these directives while making a user guide.
Doctest
The doctest directive enables tests on interactive code examples. The simplest way to do this is by specifying a prompt along with its respective output:
.. doctest::

    >>> a = 2
    >>> a
    2
This is rendered in the documentation as follows:
>>> a = 2
>>> a
2
While specifying code examples under the .. doctest:: directive, either all statements must be specified by the >>> prompt or without it.
For every prompt, any potential corresponding output must be specified immediately after it.
This directive is ideally used when there are a number of examples that need to be checked in quick succession.
A different way to specify code examples (and test them) is using the associated .. testcode:: directive which is effectively a code block:
.. testcode::

    a = 2
    print(a)
followed by its results.
The result can be specified with the .. testoutput:: block:
.. testoutput::

    2
The advantage of the testcode directive is that it is a lot simpler to
specify and amenable to copying the code to clipboard. Usually, tests are
more easily specified with this directive as the input and output are
specified in different blocks. The rendering is neater too.
Note
The doctest and testcode directives should not be assumed to
have the same namespace.
Output:
a = 2
print(a)
2
A few notes on using the doctest extension:
By default, each
testcodeanddoctestblock is run in a fresh namespace. To share a common namespace, we can specify a common group across the blocks (within a single.rstfile). For example,.. doctest:: [group_name] >>> a = 2
can be followed by some explanation followed by another code block sharing the same namespace
.. doctest:: [group_name]

  >>> print(a)
  2
To only print the code blocks (or the output), use the option
+SKIPto specify the block without the code being tested when runningmake doctest.To check the result of a
Qobjoutput, it is useful to make sure that spacing irregularities between the expected and actual output are ignored. For that, we can use the option+NORMALIZE_WHITESPACE.
Plot
Since the doctest directive cannot render matplotlib figures, we use Matplotlib’s Plot directive when rendering to LaTeX or HTML.
The plot directive can also be used in the doctest format. In this case,
when running doctests (which is enabled by specifying all statements with the
>>> prompts), tests also include those specified under the plot directive.
Example:
First we specify some data:
.. plot::
>>> import numpy as np
>>> x = np.linspace(0, 2 * np.pi, 1000)
>>> x[:10] # doctest: +NORMALIZE_WHITESPACE
array([ 0. , 0.00628947, 0.01257895, 0.01886842, 0.0251579 ,
0.03144737, 0.03773685, 0.04402632, 0.0503158 , 0.05660527])
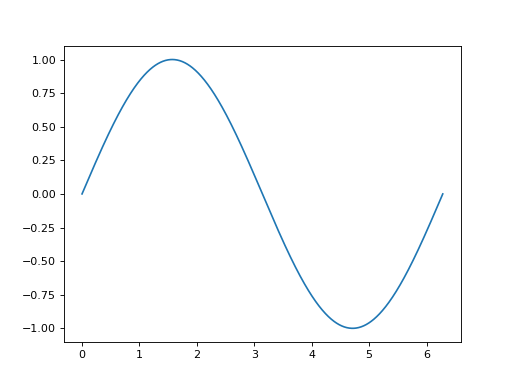
.. plot::
:context:
>>> import matplotlib.pyplot as plt
>>> plt.plot(x, np.sin(x))
[...]
Note the use of the NORMALIZE_WHITESPACE option to ensure that the
multiline output matches.
Render:
>>> import numpy as np
>>> x = np.linspace(0, 2 * np.pi, 1000)
>>> x[:10]
array([ 0.        ,  0.00628947,  0.01257895,  0.01886842,  0.0251579 ,
        0.03144737,  0.03773685,  0.04402632,  0.0503158 ,  0.05660527])
>>> import matplotlib.pyplot as plt
>>> plt.plot(x, np.sin(x))
[...]
A few notes on using the plot directive:
A useful argument to specify in plot blocks is that of
contextwhich ensures that the code is being run in the namespace of the previous plot block within the same file.By default, each rendered figure in one plot block (when using
:context:) is carried over to the next block.When the
contextargument is specified with theresetoption as:context: reset, the namespace is reset to a new one and all figures are erased.When the
contextargument is specified with theclose-figsoption as:context: reset, the namespace is reset to a new one and all figures are erased.
The Plot directive cannot be used in conjunction with Doctest because they do not share the same namespace when used in the same file. Since Plot can also be used in doctest mode, in the case where code examples require both testing and rendering figures, it is easier to use the Plot directive. To learn more about each directive, it is useful to refer to their individual pages.